A TMS backend, architecturally: cluster, coordinate streams and a typed object store
This is a walkthrough of one system's architecture — no timelines, no budgets, no feature-matrix comparisons. Just how it is built: what the pieces are, how they spread across a cluster, where the data goes and why it goes that way.
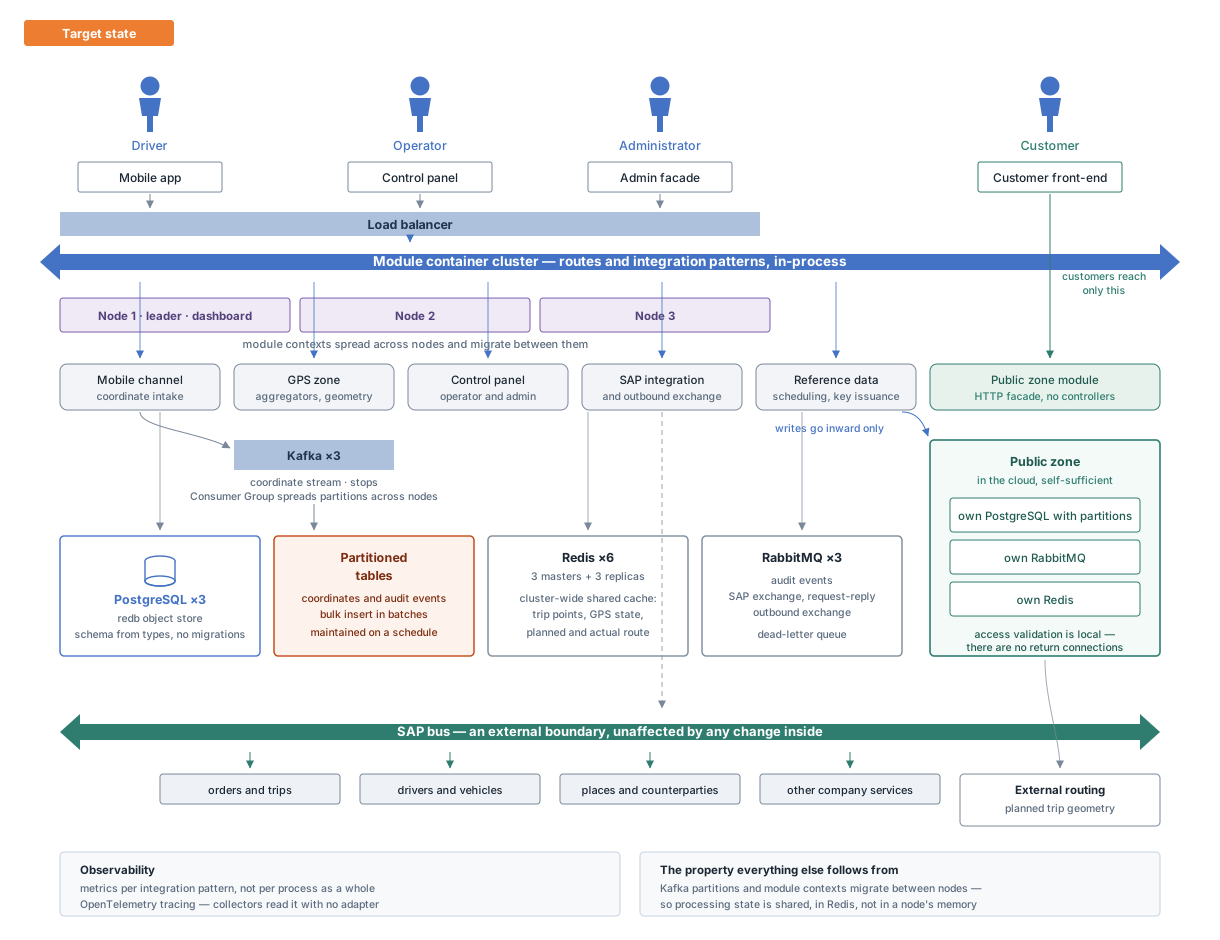
The subject, briefly. It's a transport management system. Orders arrive from SAP; a driver and a vehicle get matched against requirements for both the vehicle and the stops. A trip runs through waypoints with time windows, checklists at each stop, and handover reports with damage records when a vehicle goes out and comes back. On top of that: a stream of GPS coordinates, tracking for trips and places, a mobile app for drivers, and a public zone where the customer watches their delivery.
Fifteen modules. Three application nodes behind a balancer, RabbitMQ and Kafka three nodes each, PostgreSQL, and Redis with six.
Standalone read — the earlier posts aren't required. If the economics interest you more than the wiring, they're covered separately: what this stack costs to keep and what changed when one module moved off the ESB. This one is only about the wiring.
What the stack is made of
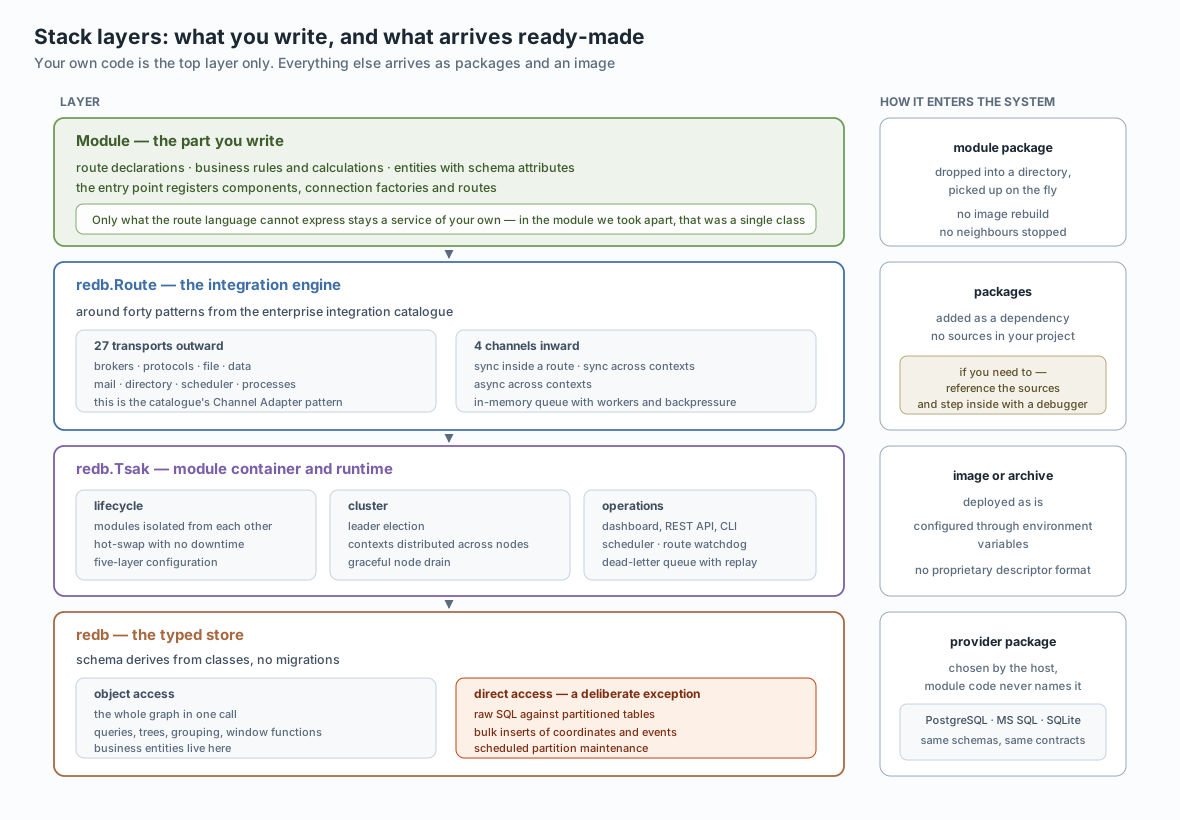
Four levels, split on one principle: your own code lives only at the top, everything below arrives as a dependency.
A module is what you write in the project: route declarations, business rules, entities carrying schema attributes. Its entry point registers transport components, named connection factories and route builders. It ships as a package, lands in a directory, and the container picks it up live.
redb.Route is the integration engine — roughly forty patterns from the enterprise integration catalogue, 27 transports outward and four channels inward. It arrives as NuGet packages; if you need to go inside, you can reference the sources instead and step through with a debugger.
redb.Tsak is the module container and runtime: lifecycle, isolation, hot-swap, clustering with leader election, a dashboard and REST API, a scheduler, a route watchdog, a dead-letter queue. It deploys as a container image or a signed archive and is configured through environment variables.
redb is the typed store. Schema derives from classes; there are no migrations. Two doors: an object-level one for business entities, and direct SQL for what deliberately does not go into the object model.
The storage provider is chosen by the host — the module code never names it. PostgreSQL, MS SQL or SQLite, same schemas and same contracts.
The unit of composition is a context, not a service
Getting the scale right matters here. The deployment unit in this system is not a microservice and not a process — it's a module with its own route context.
A module is an assembly with an entry point that receives a context and fills it: transport components, named connection factories into a registry, services, sets of routes. The container then starts the context and runs the routes.
A context gives you three things at once:
- an isolation boundary — each module gets its own assembly load context, so neighbours' dependencies don't collide;
- a unit of distribution — contexts spread across cluster nodes and migrate between them;
- a unit of control — a context can be stopped, started and restarted independently of the others.
Hence the practical consequence the whole design exists for: shipping one integration doesn't disturb the rest. The module package lands in a directory, the container picks it up and restarts only that context. Neighbours keep running; their in-flight messages survive.
Physical topology
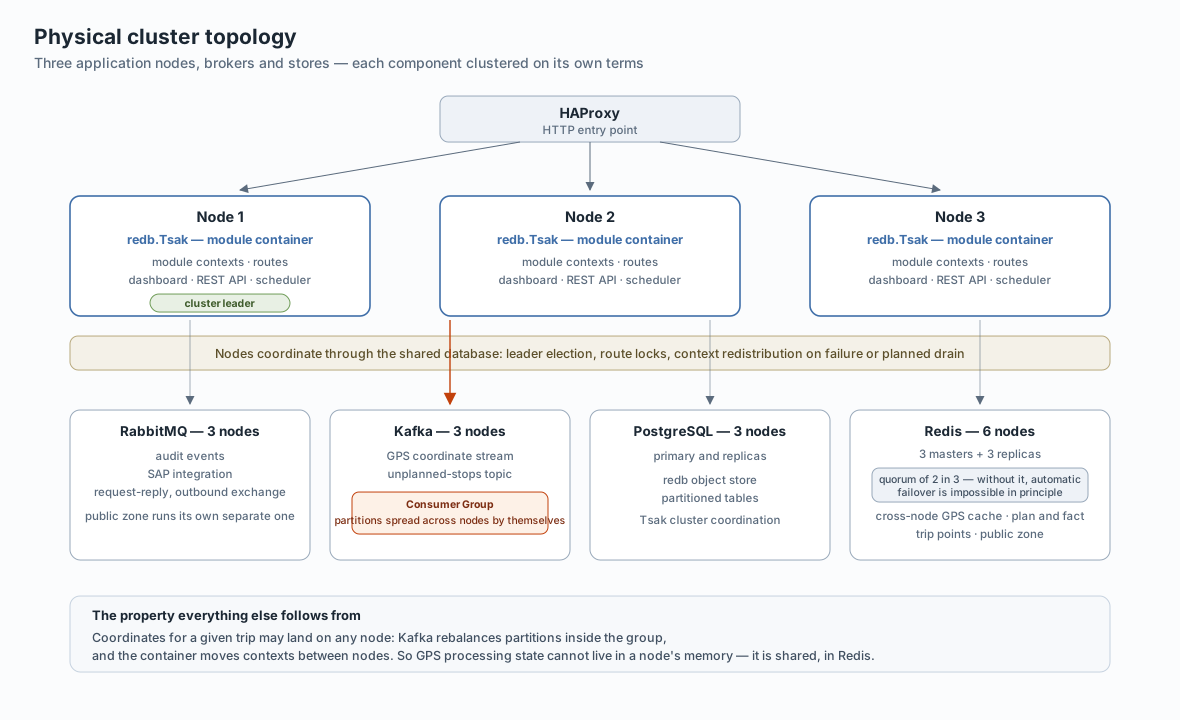
Three application nodes behind a balancer. Node coordination runs through the shared database: leader election, route locks, redistribution of contexts when a node fails or is drained on purpose.
A word on responsibility boundaries, because one runs straight through here. The architecture and the application layer are mine. Deploying and operating the infrastructure is the DevOps engineers' territory: nodes, broker clusters, the database cluster, build pipelines, delivering secrets into the runtime.
That's not a formality, it's a working split. The architecture states requirements to the infrastructure — three Redis masters so a quorum exists; Kafka partitions so a consumer group can spread across nodes; database replicas. Meeting those requirements isn't my job. So what follows describes what the system needs and why, not how it's rolled out: that's someone else's work and someone else's decisions.
Each infrastructure component is clustered separately and on its own terms:
RabbitMQ — three nodes. Audit events, SAP integration, request-reply exchanges, outbound traffic. The public zone has its own separate broker; more on that below.
Kafka — three nodes. The GPS coordinate stream and the unplanned-stops topic.
PostgreSQL — three nodes, primary and replicas. It holds the object store, the partitioned tables, and the application cluster's coordination state.
Redis — six nodes. That one is worth explaining, because six isn't superstition.
Why Redis is exactly six
Redis cluster mode requires at least three masters. The reason is quorum: the decision that a master has failed and a replica should take over is made by a majority of masters. With two masters a majority is unreachable — one node cannot be a majority of two — so automatic failover is impossible in principle.
Three masters give a two-of-three majority. Each needs a replica, otherwise losing a master means losing its slots along with the data.
Three masters plus three replicas is six. Fewer than that and you either have no automatic failover or no data redundancy.
Two zones
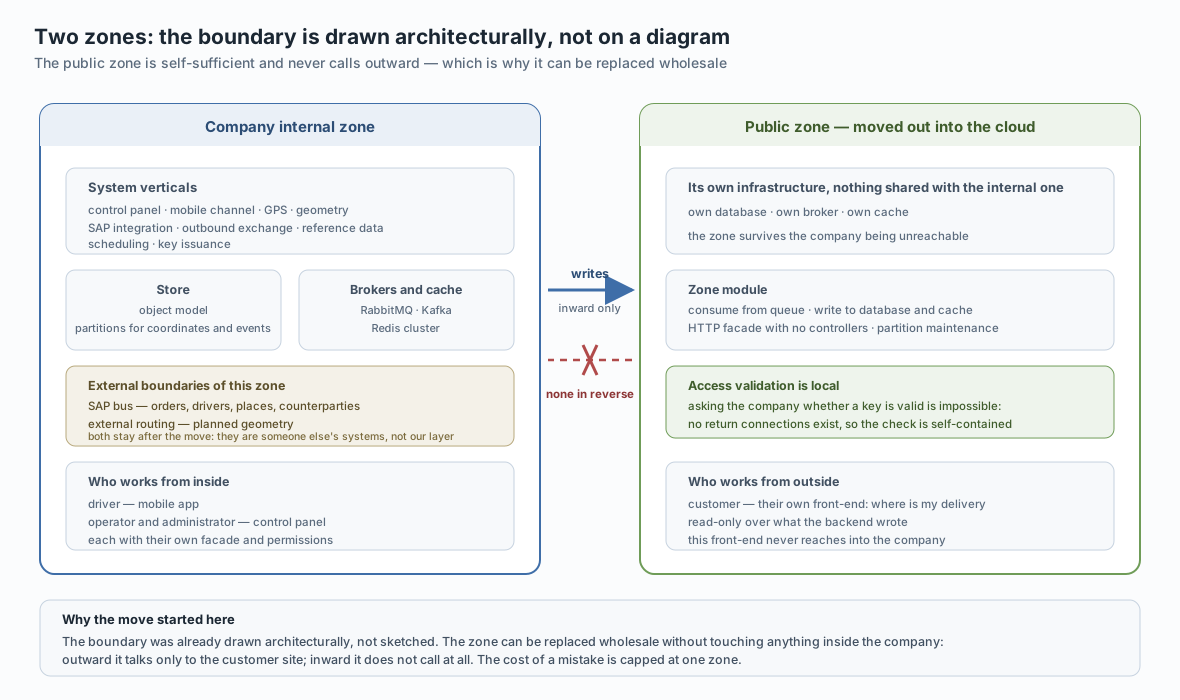
The system is cut not only into modules but into zones with different trust levels.
The internal zone holds the system's verticals, the store, the brokers and the cache. Drivers work here through the mobile app, operators and administrators through the control panel — each with their own facade and their own permissions.
The public zone sits outside the company perimeter, in the cloud. It has its own database, its own broker, its own cache — nothing shared with the internal infrastructure. Customers work here: they look up where their delivery is.
And the key property: there are no return connections. The company backend reaches into the zone and writes data. From inside the zone outward is forbidden.
From which follows an architectural requirement that would otherwise look arbitrary: access validation inside the public zone must be local. You cannot ask the company whether a key is valid — no return connection exists. So the check is self-contained and runs on data already present in the zone.
Separately about the internal zone's external boundaries. The SAP bus is not our layer but someone else's system: orders, drivers, places and counterparties arrive from it. External routing is the source of planned geometry. Both stay put through any change inside — they're boundaries, not parts.
Transports and channels
The engine distinguishes two fundamentally different kinds of connection, and it pays to keep them apart on any diagram.
Outward — 27 transports. In catalogue terms that's the Channel Adapter: brokers (RabbitMQ, Kafka, AMQP, IBM MQ, Azure Service Bus, SQS, MQTT), protocols (HTTP, gRPC, TCP, WebSocket, SignalR), files (File, FTP, SFTP, S3), data (SQL, Redis, Elasticsearch), plus mail, LDAP, Telegram, a scheduler and process execution.
Inward — four channels, each solving a different problem:
| Channel | Semantics | When you need it |
|---|---|---|
direct |
synchronous, inside a route | factor out a segment without changing control flow |
direct-vm |
synchronous, across contexts | call a neighbouring module with no network and no serialisation |
vm |
asynchronous, across contexts | decouple modules without standing up a broker |
seda |
asynchronous in-memory queue | separate processing stages with backpressure |
The last one deserves a note. seda is a bounded queue with several competing consumers and an enqueue timeout. Need to decouple fast intake from slow processing? Put one between them and set a worker count. No broker required — and the queue being bounded gives you natural backpressure instead of unbounded growth in memory.
In catalogue terms that's a Point-to-Point Channel together with Competing Consumers: a pattern closed by a kernel primitive rather than external infrastructure.
The high-frequency stream: where the object model ends
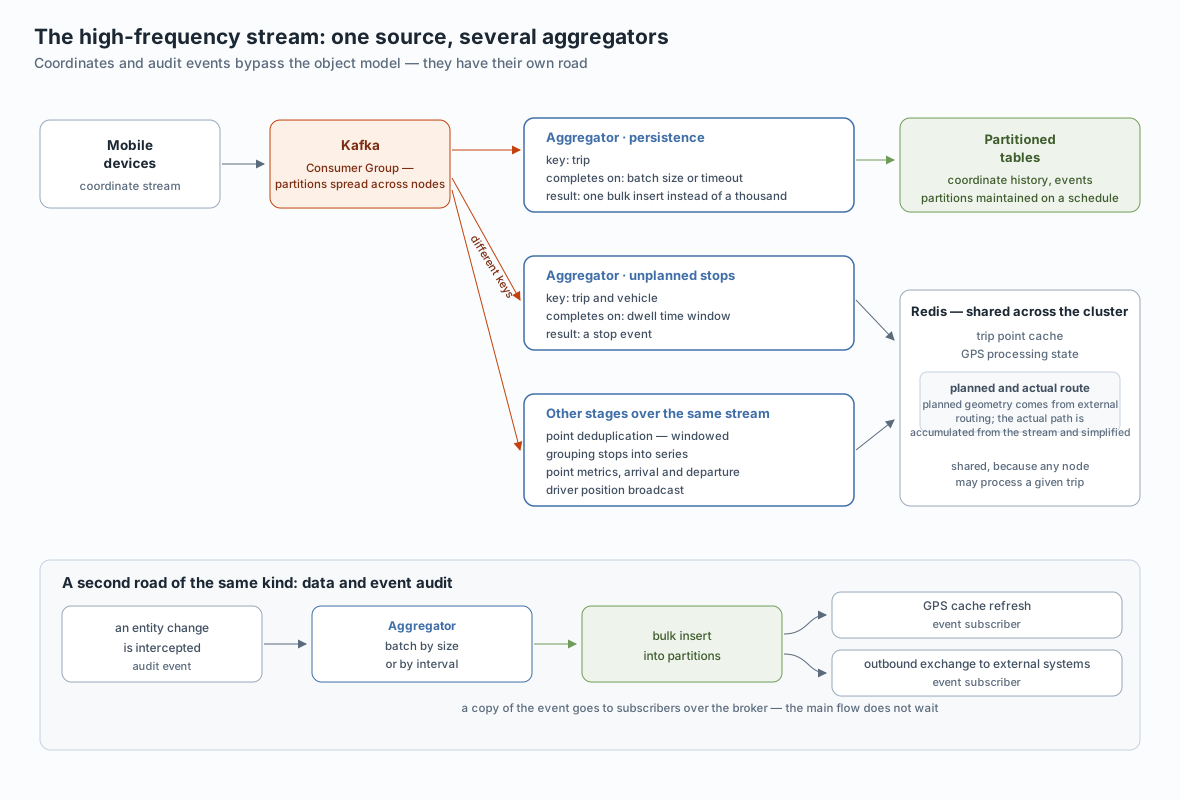
Here the architecture makes a deliberate exception, and it deserves to be stated plainly.
Business entities — trips, waypoints, orders, drivers, vehicles — live in the object store, load as a graph in one call, and derive their schema from classes. But coordinates and audit events do not go there. They have their own road: partitioned tables and direct SQL.
The reason is simple: these are streams of a different order of frequency. The object model is optimised for a typed, linked graph; here you need bulk insertion of tens of thousands of uniform rows and later deletion by whole months. Different jobs, different tools — and forcing one onto the other ends badly for both.
One source, several aggregators
Coordinates arrive on Kafka. And this is where the interesting part starts: one stream carries several aggregation stages with different correlation keys and different completion rules.
| Stage | Correlation key | Completion | Result |
|---|---|---|---|
| Persistence | trip | batch size or timeout | one bulk insert instead of a thousand singles |
| Unplanned stops | trip and vehicle | dwell time window | a stop event |
| Stop grouping | stop | end of a series | a coherent series instead of scattered points |
| Point deduplication | point | window | a stream without repeats |
Plus point metrics, arrival and departure detection, and driver position broadcast.
That's the Aggregator pattern from the catalogue, applied several times with different settings. And it has one property that matters: a group completes on size or on timeout. Without the timeout, the last partial batch would sit in memory until the next message — which on a sparse stream means data not being persisted for hours.
How the stream scales across nodes
Kafka's own mechanism does the work here, and the code carries an explicit comment about it: do not pin a partition in the endpoint address, so the consumer-group mechanism engages.
The point is that Kafka itself distributes a topic's partitions among consumers sharing a group id. A node appears — partitions rebalance toward it. A node drops — its partitions spread across the survivors. No coordinator of your own to write.
In catalogue terms that's Competing Consumers, implemented at the broker rather than in the application.
The consequence everything else grows from
And now the crux. Partitions migrate between consumers. Contexts migrate between nodes. Which means coordinates for one and the same trip may be processed by any node in the cluster, and not necessarily the one that handled them a minute ago.
Hence a hard requirement: GPS processing state cannot live in a node's memory. It's shared, in Redis. Trip-point cache, accumulated processing state, planned and actual geometry. Anything needed to continue working on a trip has to be reachable from any node.
That's exactly why the system has a dedicated shared-cache manager rather than a dictionary in process memory.
Planned route and actual route
A trip has two geometries, and they're produced in completely different ways.
The planned one comes from external routing — how the trip is supposed to run. It's built once: on the first GPS point, or when an operator saves.
The actual one accumulates from the coordinate stream — how the trip really went. It has a lot of points, so it gets simplified with the Ramer–Douglas–Peucker algorithm: the line keeps its shape while the point count drops by an order of magnitude.
Both live in the shared cache, because both are needed by any node.
The broker carries a key, not geometry
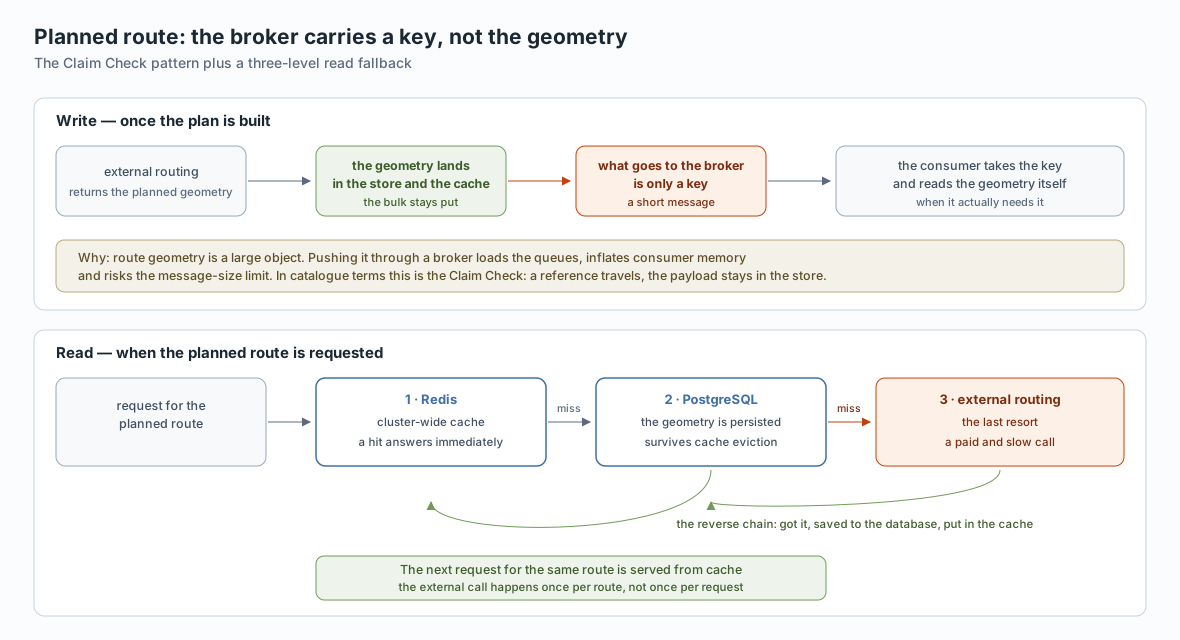
Route geometry is a large object. Pushing it through a broker means loading the queues, inflating consumer memory and eventually hitting the message-size limit.
So it's done differently: the geometry stays in the store and the cache, and the message carries only a key. The consumer takes the key and reads the data itself — when it actually needs it.
In catalogue terms that's the Claim Check: a reference in the message, the payload stored separately. An old and well-known trick, which systems nonetheless keep reinventing after first getting burned by large messages.
Reads fall back through three levels
When a planned route is requested, the lookup walks a chain:
- Redis — the cluster-wide cache. A hit answers immediately.
- PostgreSQL — the geometry is persisted and survives cache eviction.
- External routing — the last resort: a paid, slow call.
And the reverse chain: got it from the external service, save to the database, put in the cache, return. The next request for the same route is served from cache.
Net effect: the external call happens once per route, not once per request.
Audit: one event, two roads
Audit here isn't "logs just in case" but a proper layer with its own architecture. And it's built so that a single data change produces two independent flows.
Road one — into the store. An entity change is intercepted, the audit event lands in a queue, a background collector assembles a batch from it and performs a bulk insert into a partitioned table. The batch completes on size or on interval — both parameters live in configuration, not in code.
Note that this is the same pattern as on the coordinate stream. Different data, different frequency, different keys — one mechanism.
Road two — to subscribers. A copy of the event goes out through the broker to whoever needs it. Today that's at least two: GPS-zone cache refresh, and outbound exchange to external systems.
Crucially, the main flow does not wait for subscribers. The change persists at its own pace; the fan-out runs in parallel and its latency doesn't affect the write. In catalogue terms that's a Wire Tap plus a Publish-Subscribe Channel.
That construction delivers the thing audit layers are built for in the first place: any system can subscribe to changes without touching the one producing them. A new consumer of events shows up as a subscriber, and the source code doesn't change at all.
Partition maintenance
Partitioned tables need new sections created regularly and old ones dropped. That runs on a schedule, as scheduler jobs — and the scheduler is built into the container and cluster-aware, so the job doesn't fire three times on three nodes.
A detail people usually remember at the exact moment next month's partition failed to appear.
Observability
Once a system is spread over three nodes and several brokers, "where exactly is it slow" stops being answerable by reading logs.
Metrics are defined per pattern, not per engine. The aggregator reports groups completed, groups in flight and groups that fell apart on timeout. The splitter — how many parts. The filter — how many dropped. The idempotent receiver — how many passed and how many were rejected as duplicates. The circuit breaker — times tripped and calls rejected. And so on through the catalogue.
Plus end-to-end: processed, failed, currently in flight, and duration histograms for the whole exchange and for each route step.
Tracing follows OpenTelemetry, with the conventional attribute names: messaging system, destination name, operation, HTTP method, database type. Exceptions decompose into the standard fields. On top of those, its own: correlation id, exchange pattern, route, step, endpoint.
Practical consequence: trace collectors read this with no adapter. The chain "consumed from Kafka → aggregated → written as a batch → fanned out to subscribers" shows up as one trace with every step and duration.
The dashboard is a control plane, not a display
Eleven pages: overview, routes and single-route view, endpoints, cluster and node detail, scheduler, logs, audit, dead-letter queue, watchdog, access control.
And you act from them, not just look:
- an individual route — stop and start it without touching the others;
- a whole context — stop, start, restart;
- a hung route — force-stop it;
- a node — drain it gracefully: it finishes what it holds, takes no new work, hands its locks to peers; then bring it back;
- a failed exchange — inspect and replay after a fix;
- a scheduled job — fire it immediately;
- a node's effective configuration — read it with secrets redacted, without SSH.
Next to each route are its own numbers: processed, currently in flight, throughput, history. Not one process-wide graph but per route — because in operations the question is always "which integration is stuck."
Where the boundaries run
More useful than any feature list is the set of places where the architecture deliberately departs from its own rules.
Partitioned tables bypass the object model. Coordinates and audit events are written with direct SQL. A conscious choice, not an omission: streams at that frequency have different economics.
Planned geometry is stored as a large object, not a graph of points. There's nothing to gain from decomposing it into entities — it's read whole and returned whole.
Processing state lives in Redis, not the store. It's hot, short-lived and needed by every node. Putting it in the database would mean paying for durability where none is required.
Access validation is duplicated locally in the public zone. Not for convenience, but because there are no return connections and nobody to ask.
The SAP bus and external routing stay external. They aren't rewritten or "integrated more deeply" — they're reached through channel adapters, and that's the correct boundary.
What's worth taking away
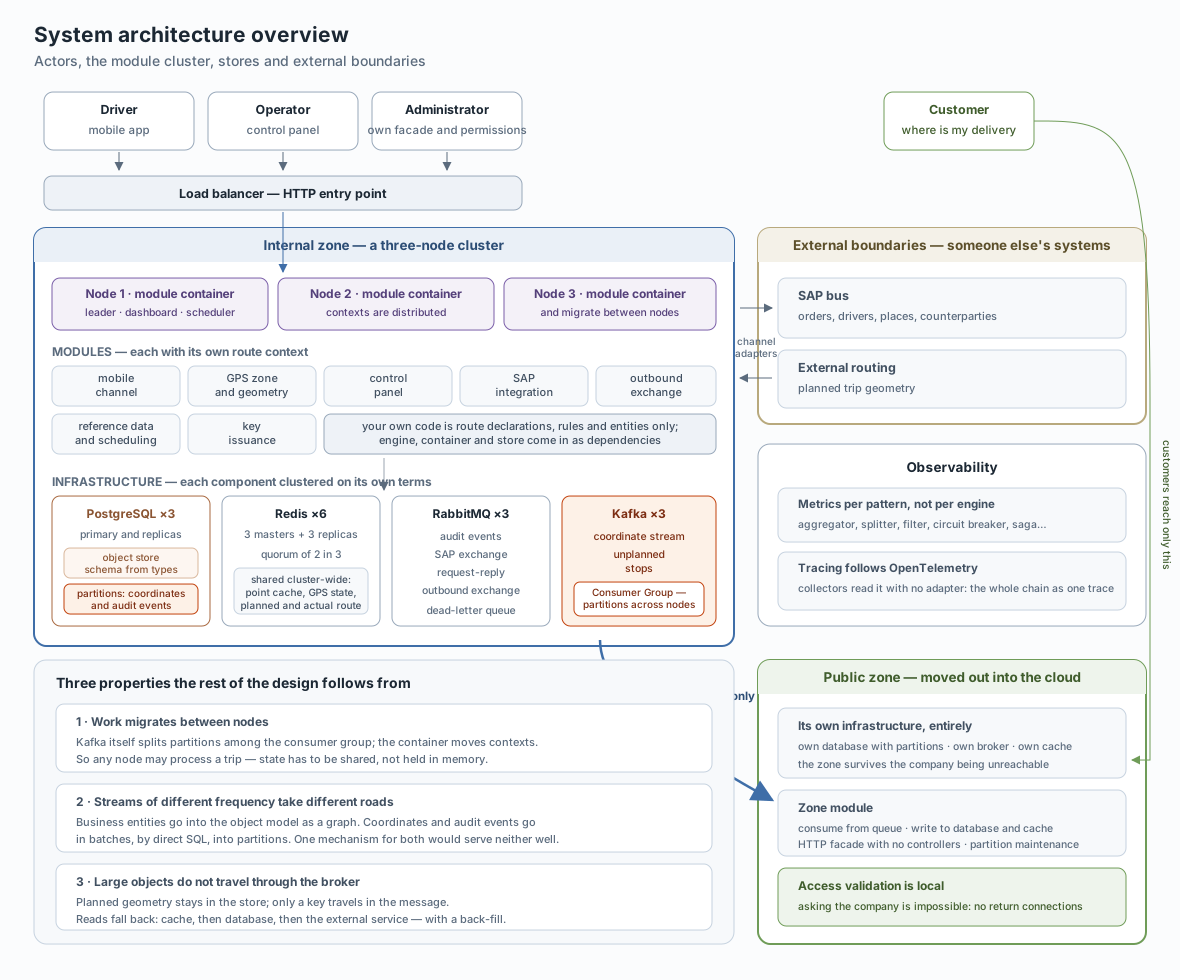
Strip the domain specifics and a few decisions transfer to any system of comparable shape.
Split flows by frequency, not by layer. Business entities and telemetry are fundamentally different loads. One storage mechanism for both usually means one of them is served badly.
An Aggregator isn't "accumulate and write" — it's a pattern with two completion conditions. Size and timeout, simultaneously. Without the second, a sparse stream simply stalls.
If state might be needed by any node, it isn't in memory. The moment a broker or a container starts redistributing work, local state turns into a source of hard-to-trace inconsistencies.
Large objects don't travel through the broker. A reference in the message, the payload in the store — and the queues stay light.
A fallback cache ends with a back-fill. Otherwise the expensive external call repeats on every request.
An event must be able to gain subscribers without editing its source. That's the property audit layers are built as layers for, rather than as a pile of log lines.
Transition status, so nothing is left unsaid: the public zone already runs on the stack described here; the remaining verticals are moving. A module-by-module before-and-after is in the second post; the economics of the "before" stack are in the first.
Sources and releases: github.com/redbase-app. About the redb store: redbase.app.
If this was useful — a ⭐ on GitHub helps others find it.